This Past Week Was A Slow One On Broadway, With The Entire Industry Bringing In Over $12 Million Less Than The Week Before, But Hamilton And The Book Of Mormon Still Performed Well
This Week’s Notable Movements on Broadway are:
A Post Holiday Slump for Broadway
In the week ending January 10, 2016, Broadway saw a major decrease in ticket sales across the board. Of the 32 shows currently running, 28 decreased in ticket sales compared to last week. Furthermore, six shows closed at the end of last week. One of the reasons for this decrease is that several shows had added extra performances during the holiday week, so in reducing to the regular eight shows a week, a decrease is noted. Still, the decreases are more profound than that. The entire industry saw a decrease of $12,664,727 from the week before, and of the 32 shows from last week that are still running this week, the average gross decreased from $1,218,600 per show the week before, to $822,827 this past week.
The biggest decreases were seen by 11 shows which all had 9 performances the week before, most notably Wicked with a decrease of $1,387,774, The Lion King with a decrease of $1,066,481, Aladdin with a decrease of $1,027,562, The Phantom of the Opera with a decrease of $880,972, and Matilda with a decrease of $867,795. The only show to offer a notable increase was The Gin Game, which brought in $500,357, up $150,578 from the week before, and only because it was that show’s final week of performances starring two veteran theatre greats: Cicely Tyson and James Earl Jones.
Only Two Shows Make Greater than Their Potential: “Hamilton” and “The Book of Mormon”
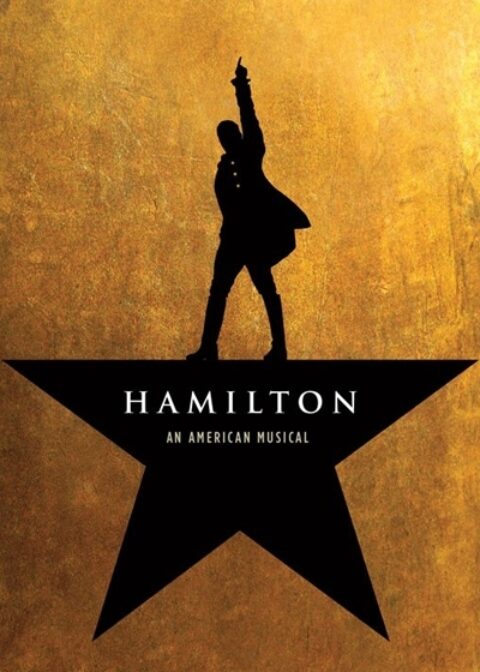
Despite seeing decreases in ticket sales from the week before, two major hits – one recent, one a few years older – still brought in over 100% of their gross potential this low-earning week on Broadway. Hamilton, which still brings in astonishing financial figures and is as tough as ticket as ever, brought in $1,712,792 this past week, which represents 128.3% of its gross potential. Last week, Hamilton did not feel the need to add an extra performance to boost their already extraordinary grosses, and brought in 146.80% of its gross potential across 8 performances. Though this was a decrease of $246,993 from the week before, it still performed to a higher gross potential than any other show on Broadway.
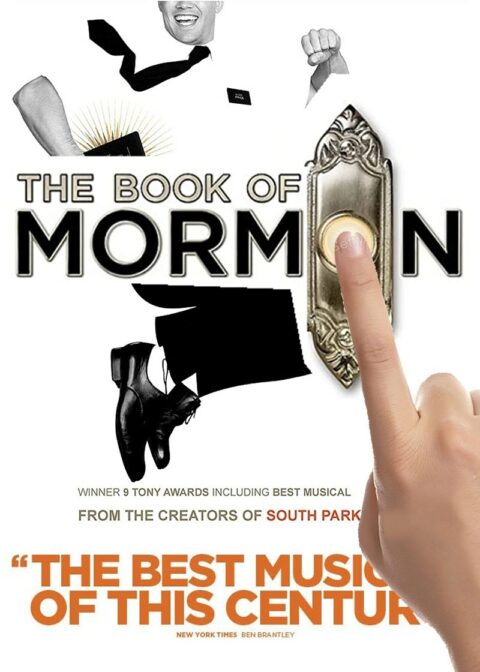
This past week, with a top ticket price of $475.00, the average paid admission was the remarkable amount of $159.23. The average audience capacity was 101.8%. Furthermore, The Book of Mormon, which has been running on Broadway for several years, is still a top-selling hit. This past week, it brought in $1,492,963, which represents 108.45% of its gross potential. Though it decreased $531,588 from the week before, that was primarily due to the fact that it played nine performances that holiday week, and the percentage reached of its gross potential only decreased by just over 1%.
The Following are the Broadway Ticket Sales Numbers for the Week Ending January 10, 2016:

| Show Name | GrossGross | TotalAttn | %Capacity | AvgPdAdm |
| A GENTLEMAN’S GUIDE TO LOVE AND MURDER | $584,067 | 6,622 | 91.26% | $88.20 |
| A VIEW FROM THE BRIDGE | $529,395 | 6,840 | 83.74% | $77.40 |
| ALADDIN | $1,370,548 | 13,710 | 99.23% | $99.97 |
| ALLEGIANCE | $384,482 | 5,316 | 62.87% | $72.33 |
| AN AMERICAN IN PARIS | $855,948 | 8,486 | 63.18% | $100.87 |
| BEAUTIFUL | $886,369 | 7,078 | 86.23% | $125.23 |
| CHICAGO | $498,231 | 6,141 | 71.08% | $81.13 |
| CHINA DOLL | $631,375 | 4,886 | 76.18% | $129.22 |
| FIDDLER ON THE ROOF | $1,051,184 | 11,728 | 85.88% | $89.63 |
| FINDING NEVERLAND | $720,499 | 8,533 | 70.92% | $84.44 |
| FUN HOME | $535,525 | 5,656 | 95.54% | $94.68 |
| HAMILTON | $1,712,792 | 10,757 | 101.79% | $159.23 |
| JERSEY BOYS | $761,766 | 8,229 | 83.76% | $92.57 |
| KING CHARLES III | $652,313 | 6,675 | 85.40% | $97.72 |
| KINKY BOOTS | $803,807 | 8,253 | 72.45% | $97.40 |
| LES MISÉRABLES | $713,975 | 8,307 | 73.70% | $85.95 |
| MATILDA | $689,029 | 8,988 | 78.46% | $76.66 |
| MISERY | $668,037 | 6,647 | 70.65% | $100.50 |
| NOISES OFF | $366,803 | 5,679 | 95.93% | $64.59 |
| ON YOUR FEET! | $1,121,842 | 9,808 | 75.40% | $114.38 |
| OUR MOTHER’S BRIEF AFFAIR | $167,332 | 3,178 | 69.85% | $52.65 |
| SCHOOL OF ROCK | $981,822 | 9,541 | 83.52% | $102.91 |
| SOMETHING ROTTEN! | $760,654 | 9,416 | 76.19% | $80.78 |
| SPRING AWAKENING | $618,339 | 7,609 | 92.70% | $81.26 |
| THE BOOK OF MORMON | $1,492,963 | 8,719 | 102.24% | $171.23 |
| THE COLOR PURPLE | $787,187 | 7,115 | 84.62% | $110.64 |
| THE CURIOUS INCIDENT OF THE DOG IN THE NIGHT-TIME | $554,435 | 6,780 | 83.25% | $81.78 |
| THE GIN GAME | $500,357 | 6,014 | 93.73% | $83.20 |
| THE KING AND I | $794,737 | 7,148 | 85.34% | $111.18 |
| THE LION KING | $1,812,024 | 13,491 | 99.43% | $134.31 |
| THE PHANTOM OF THE OPERA | $770,315 | 9,225 | 71.85% | $83.50 |
| WICKED | $1,552,322 | 13,123 | 90.78% | $118.29 |
| Totals | $26,330,471 | 259,698 | 83.04% | $98.24 |
Broadway ticket sales raw data are provided courtesy of The Broadway League All other data, text, opinion, charts and commentary are copyright © 2016 nytix.com


