Hamilton Rules The Day Once Again, Outperforming Every Other Show In The Week Of The Snowstorm, Meanwhile, The Humans Has Had A Modest Start At The Helen Hayes Theatre On Broadway
This Week’s Notable Movements on Broadway are:
Snowstorm Took a Major Toll on Broadway Ticket Sales
This past week, the majority of Broadway shows played only six performances due to the snowstorm on Saturday and the subsequent public transportation shutdown. Losing both the matinee and the evening performances on Saturday, most productions did play their Sunday shows, and yet they still offered in advance ticket exchanges for those patrons who were unable to travel to the theatre due to the storm. Therefore, the overall industry, with a total of 31 shows presently running, saw a decrease in ticket sales of $9,584,129 from the week before. Whereas last week the average weekly gross per show was $852,070, this past week it was only $515,418.
Even the best indicator of a show’s performance despite the cancellations, the percentage reached of gross potential across performances actually played, was not very encouraging. Every single show also saw a decrease in percentage of gross potential, perhaps due to the Sunday ticket exchanges on top of overall low sales due to the winter season. It did not help that this took place during Broadway week, where 2-for-1 deals were offered for many shows. If anything, that only brought more discount ticket buyers to the theatre, many of whom were then unable to get to the theatre.
“Hamilton” the Only Runaway Hit; “The Humans” Off to Mediocre Start
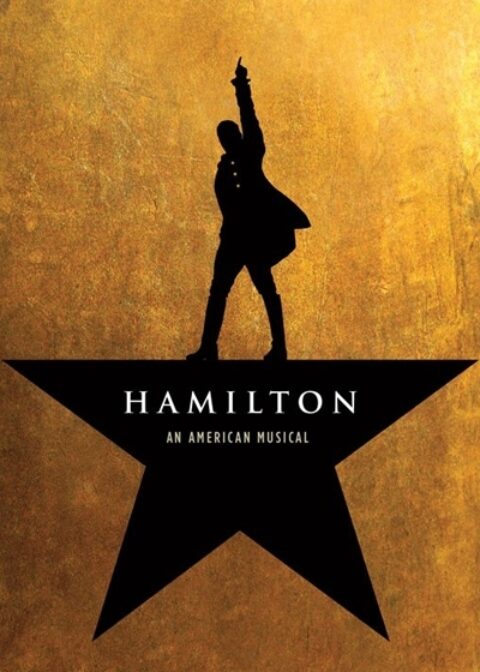
Even though Hamilton, like the others, was forced to cancel both of its Saturday shows, the buzzy musical still performed extraordinarily, bringing in $1,304,793 which was 130.3% of its gross potential. As tough as it is to get a ticket to this show, a mere snowstorm would not dissuade ticket holders from roughing it to get to the theatre district, if at all humanly possible. Though Hamilton did bring in $464,567 less than the week before, and did have a drop of 2.22% in percentage reached of gross potential, the show is still outperforming the long-running hits on Broadway. The only other show to cross the million dollar mark this past week was The Lion King, which barely made it into the millionaire’s club with a gross of $1,063,040.
One new show began previews this past week: The Humans at the Helen Hayes Theatre. With only one preview performance this past week, and taking place on the Sunday when the snowstorm had just passed, it is difficult to discern the future performance of the show based on last week’s figures alone. Nevertheless, in this one performance, it brought in $32,574, which represents 50.9% of the show’s gross potential.
Scott Rudin Leads Broadway Transfer
With a top ticket price of $223.00, the average paid admission was $65.15. Although this show played Off-Broadway in a Roundabout Theatre Company production, it transfers to Broadway in a non-Roundabout Theatre, the Helen Hayes, with Scott Rudin as lead producer and Roundabout functioning as a co-producer. Therefore, it is a commercial production with the same pressures as any show not produced by a not-for-profit theatre institution.
The Following are the Broadway Ticket Sales Numbers for the Week Ending January 24, 2016:

| Show Name | GrossGross | TotalAttn | %Capacity | AvgPdAdm |
| A VIEW FROM THE BRIDGE | $325,572 | 4,723 | 77.10% | $68.93 |
| ALADDIN | $831,498 | 9,253 | 89.30% | $89.86 |
| ALLEGIANCE | $262,562 | 4,007 | 63.18% | $65.53 |
| AN AMERICAN IN PARIS | $516,420 | 5,801 | 57.58% | $89.02 |
| BEAUTIFUL | $596,405 | 5,536 | 89.93% | $107.73 |
| CHICAGO | $270,842 | 3,573 | 55.14% | $75.80 |
| CHINA DOLL | $358,928 | 3,773 | 70.59% | $95.13 |
| FIDDLER ON THE ROOF | $657,219 | 8,093 | 79.02% | $81.21 |
| FINDING NEVERLAND | $642,844 | 7,632 | 84.57% | $84.23 |
| FUN HOME | $340,120 | 3,799 | 85.56% | $89.53 |
| HAMILTON | $1,304,793 | 8,062 | 101.72% | $161.84 |
| JERSEY BOYS | $344,021 | 4,304 | 58.41% | $79.93 |
| KING CHARLES III | $457,695 | 4,961 | 84.63% | $92.26 |
| KINKY BOOTS | $477,468 | 5,490 | 64.26% | $86.97 |
| LES MISÉRABLES | $405,742 | 5,368 | 63.50% | $75.59 |
| MATILDA | $368,576 | 5,533 | 64.40% | $66.61 |
| MISERY | $391,901 | 4,513 | 63.96% | $86.84 |
| NOISES OFF | $300,106 | 4,040 | 90.99% | $74.28 |
| ON YOUR FEET! | $732,366 | 7,322 | 75.05% | $100.02 |
| OUR MOTHER’S BRIEF AFFAIR | $109,716 | 3,125 | 80.13% | $35.11 |
| SCHOOL OF ROCK | $526,274 | 6,481 | 75.64% | $81.20 |
| SOMETHING ROTTEN! | $427,882 | 5,689 | 65.41% | $75.21 |
| SPRING AWAKENING | $545,145 | 6,035 | 98.03% | $90.33 |
| THE BOOK OF MORMON | $968,563 | 6,450 | 100.84% | $150.16 |
| THE COLOR PURPLE | $549,933 | 5,697 | 90.34% | $96.53 |
| THE CURIOUS INCIDENT OF THE DOG IN THE NIGHT-TIME | $344,769 | 5,277 | 86.39% | $65.33 |
| THE HUMANS | $32,574 | 500 | 86.51% | $65.15 |
| THE KING AND I | $444,069 | 4,872 | 77.55% | $91.15 |
| THE LION KING | $1,063,040 | 8,750 | 85.99% | $121.49 |
| THE PHANTOM OF THE OPERA | $397,769 | 5,683 | 59.01% | $69.99 |
| WICKED | $983,150 | 10,375 | 95.69% | $94.76 |
| Totals | $15,977,958 | 174,717 | 78.08% | $87.35 |
Broadway ticket sales raw data are provided courtesy of The Broadway League All other data, text, opinion, charts and commentary are copyright © 2016 nytix.com


