This Past Week, Broadway Saw A Strong Upsurge In Ticket Sales With The Entire Industry Picking Up, Except The Lone Hamilton.
Broadway Surges Into Spring
In the week ending March 13, 2016, Broadway saw a major increase in ticket sales. Among the 31 shows currently running, the overall Broadway box office was a total of $23,720,003, which is an increase of $3,207,944 from the week before. Whereas last week had an average gross per show of $661,679, this past week the average weekly gross per show was $765,161.
Of these 31 shows, every single show saw an increase in ticket sales – except one. Surprisingly, the only show to go down in box office gross this week is the biggest hit of the year: Hamilton. While the decrease was negligible, only $7,668 bringing it down to a weekly gross of $1,758,555, the only explanation is that the show has almost completely saturated its gross potential. This past week, it reached the outstanding percentage of its gross potential of 131.7%, which is by far the greatest of any show running.
Big Increase For "Wicked" In The Box Office
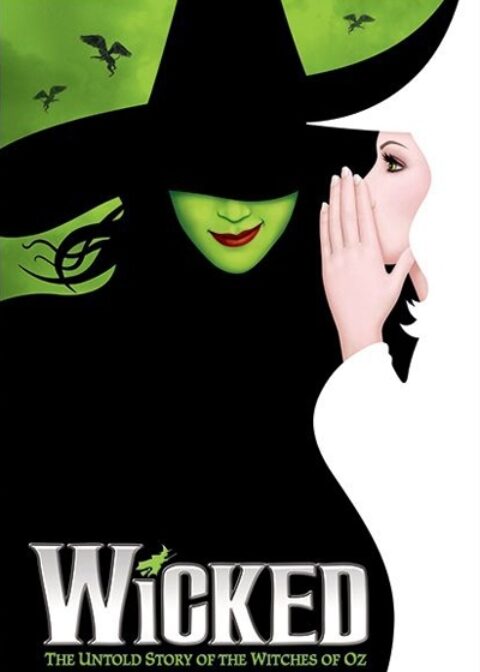
Nevertheless, in comparison to last week’s performance, the biggest increase was seen by Wicked, which is finally getting back up to its warm weather numbers with a weekly gross of $1,662,470, an increase of $325,463 from the week before. Similarly, The Lion King brought in $1,708,789, which is an increase of $247,458 from the week before.
Other major increases were seen by Aladdin, up by $245,936, Kinky Boots, up by $182,767, The Phantom of the Opera, up by $171,237, School of Rock, up by $170,854, Les Misérables, up by $164,125, The King and I, up by $163,509, and An American in Paris, up by $152,533.
Newer Plays Still Finding Their Footing
This season, there are a slew of new plays that are either still in previews or have just recently opened. Thus far, the most promising is Ivo van Hove’s production of Arthur Miller’s The Crucible, which stars Oscar nominee Saoirse Ronan. This past week, The Crucible brought in $583,709, which represents 72.3% of its gross potential. With a top ticket price of $327.00, the average paid admission was $94.50.
This show only began previews on March 1, 2016, and is scheduled for an opening night on March 31, 2016. Therefore, there is still time for word of mouth to spread and laudatory reviews to boost box office. In addition, Eclipsed is a new play that recently transferred to Broadway after an acclaimed production at the Public Theater, which is also the originating home of Hamilton and Fun Home. This play stars Lupita Nyong’o, who took home an Academy Award for Best Support Actress for her acclaimed role in Twelve Years a Slave.
Need For Balancing Demand At Ticket Pricing
Despite her widespread fame, that show is having trouble reaching its gross potential, even though reviews have already come out. This past week, it brought in a weekly gross of $421,319, which represents just 51.3% of its gross potential. With a top ticket price of $198.00, the average paid admission was $74.05.
Nevertheless, the audiences were quite full, to an average capacity of 88.7%, which represents strong demand but the need for discounting. As for other new plays this season, The Humans brought in $380,140, or 69.7% of its gross potential, Blackbird brought in $411,984, or 46.6% of its gross potential, and Hughie brought in $295,800, or 37.7% of its gross potential.
The following are the Broadway ticket sales numbers for the week ending March 13, 2016:
| # | Show Name | GrossGross | TotalAttn | %Capacity | AvgPdAdm |
| 5 | ALADDIN | $1,325,184 | 13,639 | 98.72% | $97.16 |
| 10 | AN AMERICAN IN PARIS | $856,835 | 9,329 | 69.45% | $91.85 |
| 7 | BEAUTIFUL | $918,575 | 7,888 | 96.10% | $116.45 |
| 26 | BLACKBIRD | $411,984 | 6,519 | 80.36% | $63.20 |
| 30 | BRIGHT STAR | $301,410 | 6,481 | 77.30% | $46.51 |
| 22 | CHICAGO | $469,188 | 6,010 | 69.56% | $78.07 |
| 29 | DISASTER! | $318,847 | 5,729 | 59.78% | $55.65 |
| 25 | ECLIPSED | $421,319 | 5,690 | 88.68% | $74.05 |
| 9 | FIDDLER ON THE ROOF | $888,243 | 10,125 | 74.14% | $87.73 |
| 17 | FINDING NEVERLAND | $659,099 | 8,500 | 70.64% | $77.54 |
| 23 | FUN HOME | $466,331 | 5,371 | 90.73% | $86.82 |
| 1 | HAMILTON | $1,758,555 | 10,756 | 101.78% | $163.50 |
| 31 | HUGHIE | $295,800 | 4,083 | 66.11% | $72.45 |
| 20 | JERSEY BOYS | $564,025 | 6,387 | 65.01% | $88.31 |
| 11 | KINKY BOOTS | $844,214 | 8,630 | 75.75% | $97.82 |
| 15 | LES MISÉRABLES | $698,731 | 8,945 | 79.36% | $78.11 |
| 16 | MATILDA | $683,263 | 8,745 | 76.34% | $78.13 |
| 21 | NOISES OFF | $557,404 | 5,999 | 101.33% | $92.92 |
| 6 | ON YOUR FEET! | $973,702 | 9,308 | 71.56% | $104.61 |
| 8 | SCHOOL OF ROCK | $900,072 | 10,058 | 88.04% | $89.49 |
| 27 | SHE LOVES ME | $409,091 | 7,360 | 91.27% | $55.58 |
| 12 | SOMETHING ROTTEN! | $765,481 | 9,167 | 76.19% | $83.50 |
| 4 | THE BOOK OF MORMON | $1,353,456 | 8,744 | 102.53% | $154.79 |
| 13 | THE COLOR PURPLE | $742,916 | 7,168 | 85.25% | $103.64 |
| 19 | THE CRUCIBLE | $583,709 | 6,177 | 97.83% | $94.50 |
| 24 | THE CURIOUS INCIDENT OF THE DOG IN THE NIGHT-TIME | $444,027 | 5,791 | 71.11% | $76.68 |
| 28 | THE HUMANS | $380,140 | 4,250 | 92.23% | $89.44 |
| 18 | THE KING AND I | $633,677 | 6,646 | 79.35% | $95.35 |
| 2 | THE LION KING | $1,708,789 | 13,413 | 98.86% | $127.40 |
| 14 | THE PHANTOM OF THE OPERA | $723,466 | 8,615 | 67.10% | $83.98 |
| 3 | WICKED | $1,662,470 | 14,103 | 97.56% | $117.88 |
| Totals | $23,719,998 | 249,626 | 82.58% | $91.07 |


