In The Week Ending April 10, 2016, Broadway Took Another Tip Of Over 3 Million Dollars. Shuffle Along Had Limited Performances.
Broadway Takes Another Dip Downwards
In the week ending April 10, 2016, the Broadway industry experienced another decrease in ticket sales overall. Of the 36 shows currently running, 10 had an increase in ticket sales, and 26 had a decrease in ticket sales. Across the board, the entire industry experienced a decrease of $3,035,339, bringing in a collective gross of $26,894,101 for the 36 shows.
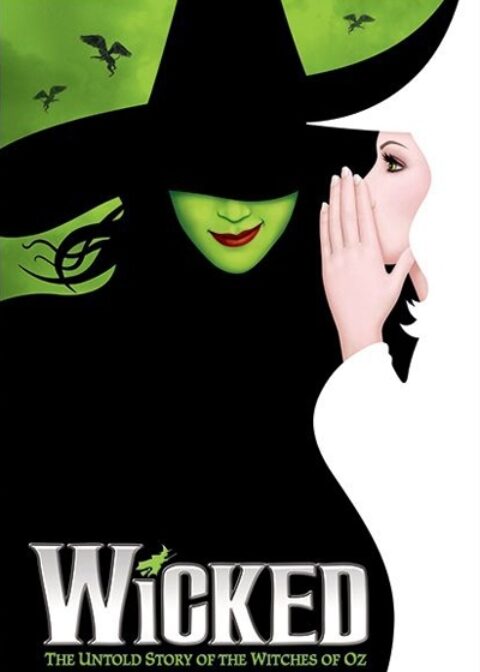
This represents an average gross of $747,058 per show, which is a decrease from last week’s average gross of $831,373. The biggest decrease was seen by Wicked, which went down by $539,247 to a weekly gross of $1,676,579, although this still represents 94.2% of its gross potential.
Decreases Across The Board, Including "Hamilton"
Next was Aladdin, which decreased by $356,824 to reach a weekly gross of $1,494,139. School of Rock decreased by $343,197 to reach a weekly gross of $993,584, Finding Neverland decreased by $314,580 to reach a weekly gross of $610,077, Matilda decreased by $304,540 to reach a weekly gross of $807,649, and The Lion King decreased by $293,507 to reach a weekly gross of $1,996,041. Even Hamilton decreased by $8,939 to reach a weekly gross of $1,813,655, which still represents 135.9% of its gross potential.
“Shuffle Along” Performs Very Well Despite Inconsistent Schedule
This past week, Shuffle Along, or, the Making of the Musical Sensation of 1912 and All That Followed was back to its regular schedule of a 7-performance week. In the previous week, the show played only 2 performances, and in the week before that, it played only 3. In the week ending March 27, 2016, four preview performances were cancelled because Audra McDonald was ill, and needed to stay home to rest.
The following week, performances were cancelled for a hiatus that allowed the creative team to pause and do some rewrites, especially as the show came to Broadway “cold” without an out-of-town tryout. When they returned on April 1st, the producers offered $40 benefit tickets in order to thank the fans who lined up outside the theatre for $40 rush tickets, and were turned away due to a lack of performances.
Broadway Buzz Builds For "Shuffle Along"
Despite all of these difficulties, the box office has remained relatively strong. Although the running costs may have been higher than the box office in the slower weeks, the percentage reached of gross potential was still quite high. This past week, the show brought in $766,912, which is an increase of $531,912 from the week before, and represents 82.15% of its gross potential. Furthermore, the audience was filled up to 99.7% of capacity on average.
In comparison, the previous week of only two performances brought in 85.89% of its gross potential and had an average audience capacity of 100.0%. The week of three performances before that brought in 86.45% of its gross potential and had an average audience capacity of 100.0% as well. Therefore, sufficient buzz is building for this show, such that when it opens on April 28, 2016, it may be able to reach the hit status it is vying for.
The following are the Broadway ticket sales numbers for the week ending April 10, 2016:
| # | Show Name | GrossGross | TotalAttn | %Capacity | AvgPdAdm |
| 4 | ALADDIN | $1,494,139 | 13,507 | 97.76% | $110.62 |
| 25 | AMERICAN PSYCHO | $472,563 | 6,841 | 94.79% | $69.08 |
| 9 | AN AMERICAN IN PARIS | $900,006 | 10,212 | 76.03% | $88.13 |
| 10 | BEAUTIFUL | $882,474 | 7,203 | 87.76% | $122.51 |
| 26 | BLACKBIRD | $433,038 | 5,443 | 67.10% | $79.56 |
| 29 | BRIGHT STAR | $391,861 | 5,600 | 66.79% | $69.98 |
| 23 | CHICAGO | $494,896 | 6,189 | 71.63% | $79.96 |
| 34 | DISASTER! | $291,351 | 4,420 | 46.12% | $65.92 |
| 35 | ECLIPSED | $281,599 | 3,954 | 61.63% | $71.22 |
| 14 | FIDDLER ON THE ROOF | $770,572 | 8,606 | 63.02% | $89.54 |
| 21 | FINDING NEVERLAND | $610,077 | 7,790 | 64.74% | $78.32 |
| 31 | FULLY COMMITTED | $386,498 | 5,372 | 73.47% | $71.95 |
| 28 | FUN HOME | $418,140 | 5,102 | 86.18% | $81.96 |
| 2 | HAMILTON | $1,813,655 | 10,754 | 101.76% | $168.65 |
| 22 | JERSEY BOYS | $495,098 | 5,712 | 58.14% | $86.68 |
| 20 | KINKY BOOTS | $626,626 | 6,744 | 59.20% | $92.92 |
| 17 | LES MISÉRABLES | $689,608 | 8,589 | 76.20% | $80.29 |
| 32 | LONG DAY’S JOURNEY INTO NIGHT | $356,646 | 4,573 | 88.28% | $77.99 |
| 13 | MATILDA | $807,649 | 9,796 | 85.51% | $82.45 |
| 12 | ON YOUR FEET! | $864,813 | 8,577 | 65.94% | $100.83 |
| 6 | SCHOOL OF ROCK | $993,584 | 10,165 | 84.99% | $97.75 |
| 24 | SHE LOVES ME | $492,102 | 6,094 | 75.57% | $80.75 |
| 15 | SHUFFLE ALONG, OR, THE MAKING OF THE MUSICAL SENSATION OF 1921 AND ALL THAT FOLLOWED | $766,912 | 6,719 | 99.67% | $114.14 |
| 18 | SOMETHING ROTTEN! | $688,616 | 8,247 | 68.54% | $83.50 |
| 5 | THE BOOK OF MORMON | $1,322,498 | 8,728 | 102.35% | $151.52 |
| 16 | THE COLOR PURPLE | $694,145 | 6,832 | 81.26% | $101.60 |
| 19 | THE CRUCIBLE | $688,299 | 6,760 | 88.95% | $101.82 |
| 27 | THE CURIOUS INCIDENT OF THE DOG IN THE NIGHT-TIME | $425,606 | 5,616 | 68.96% | $75.78 |
| 36 | THE FATHER | $243,636 | 4,596 | 88.38% | $53.01 |
| 30 | THE HUMANS | $390,555 | 4,271 | 92.69% | $91.44 |
| 7 | THE KING AND I | $918,970 | 7,687 | 91.77% | $119.55 |
| 1 | THE LION KING | $1,996,041 | 13,452 | 99.15% | $148.38 |
| 8 | THE PHANTOM OF THE OPERA | $910,453 | 10,912 | 84.98% | $83.44 |
| 33 | TUCK EVERLASTING | $324,493 | 6,726 | 82.76% | $48.24 |
| 11 | WAITRESS | $880,303 | 8,356 | 99.95% | $105.35 |
| 3 | WICKED | $1,676,579 | 14,143 | 97.83% | $118.54 |
| Totals | $26,894,099 | 274,288 | 80.55% | $92.87 |


