Broadway Show Ticket Sales Analysis For Week Ending 01/20/2013 Reflects A Modest Increase In Ticket Sales Through The Winter Slow-Down
Modest Increase In Broadway Ticket Sales
Following last week's nosedive in Broadway ticket revenue, this week saw total ticket sales increase by nearly two million dollars, raising from $17,802,126 to $19,579,646. Barring a miracle, though, the winter doldrums are likely to ensure that Broadway sales remain modest for the next couple months.
"Glengarry", "Golden Boy", And "Peter" End Their Runs
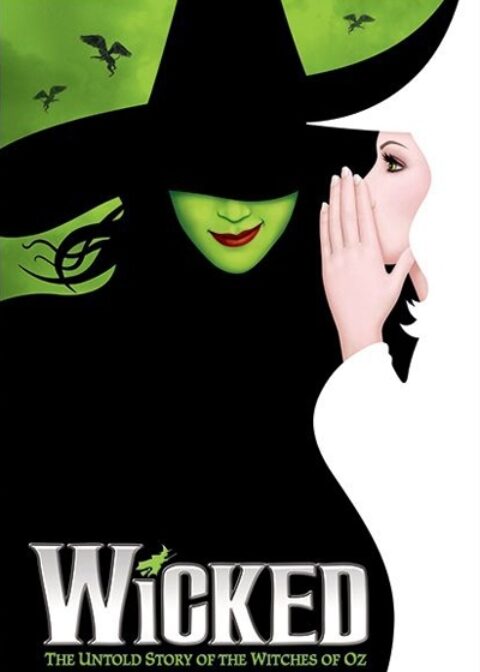
Three Broadway plays sold their final tickets last week, as their runs concluded on January 20. Glengarry Glen Ross featuring Al Pacino went out with a bang, one of just six shows to make over a million this week -- and the only one of those that's a play (the other Millionaire Club members were The Book of Mormon, The Lion King, Spiderman, Evita, and the week's top earner, Wicked).
Golden Boy enjoyed better than usual attendance during its final week, filling the theater to 84.35% capacity. And Peter and the Starcatcher performed respectably, earning a total of $502,223, with an average paid admission of $79.55.
Barry Manilow Comes To Broadway
Grammy Award winning songwriter and recording artist Barry Manilow began performances of his limited-run Barry Manilow on Broadway concerts, and so far his fans have been coming out in droves. Filling the theater to 88.47% capacity, the show sold tickets at an impressive average paid admission of $155.22.
The following are the Broadway ticket sales numbers from the week ending January 20, 2013:
| Show Name | GrossGross | TotalAttn | %Cap | AvgPaidAdm |
| ANNIE | $902,883 | 9,531 | 69.75% | $94.73 |
| CAT ON A HOT TIN ROOF | $891,457 | 10,203 | 92.15% | $87.37 |
| CHICAGO | $502,373 | 6,403 | 74.11% | $78.46 |
| EVITA | $1,018,693 | 10,289 | 79.78% | $99.01 |
| GLENGARRY GLEN ROSS | $1,070,538 | 7,587 | 88.63% | $141.10 |
| GOLDEN BOY | $471,181 | 6,559 | 84.35% | $71.84 |
| JERSEY BOYS | $823,113 | 7,644 | 77.81% | $107.68 |
| MAMMA MIA! | $633,996 | 8,590 | 71.68% | $73.81 |
| MANILOW ON BROADWAY | $447,956 | 2,886 | 88.47% | $155.22 |
| MARY POPPINS | $696,998 | 9,490 | 66.01% | $73.45 |
| NEWSIES | $793,300 | 8,106 | 84.79% | $97.87 |
| NICE WORK IF YOU CAN GET IT | $757,128 | 7,764 | 67.44% | $97.52 |
| ONCE | $951,399 | 7,857 | 92.83% | $121.09 |
| PETER AND THE STARCATCHER | $502,223 | 6,313 | 76.02% | $79.55 |
| PICNIC | $235,067 | 4,513 | 76.23% | $52.09 |
| ROCK OF AGES | $445,141 | 4,295 | 92.09% | $103.64 |
| SPIDER-MAN TURN OFF THE DARK | $1,266,814 | 13,299 | 86.13% | $95.26 |
| THE BOOK OF MORMON | $1,655,074 | 8,752 | 102.63% | $189.11 |
| THE HEIRESS | $596,439 | 6,394 | 84.04% | $93.28 |
| THE LION KING | $1,547,560 | 13,132 | 97.88% | $117.85 |
| THE MYSTERY OF EDWIN DROOD | $380,259 | 5,925 | 73.77% | $64.18 |
| THE OTHER PLACE | $278,002 | 4,178 | 81.09% | $66.54 |
| THE PHANTOM OF THE OPERA | $722,379 | 9,418 | 73.35% | $76.70 |
| WHO’S AFRAID OF VIRGINIA WOOLF? | $289,650 | 3,503 | 64.16% | $82.69 |
| WICKED | $1,700,024 | 13,768 | 95.14% | $123.48 |
| Total: | $19,579,646 | 196,399 | 81.61% | $97.74 |
Broadway ticket sales raw data are provided courtesy of The Broadway League All other data, text, opinion, charts and commentary are copyright © 2012 nytix.com


