Broadway Show Ticket Sales Analysis For Week Ending 11/24/2013 With Ticket Sales Dropping Across The Industry, Spider-Man Closes With Weak Sales
Broadway Ticket Sales Continue To Fall
The (hopefully) lucrative Thanksgiving holiday can't come fast enough this year, as Broadway has seen another dive in ticket sales this week. Overall Broadway revenue was down by well over one million dollars, with sales falling from $24,670,329 down to this week's $23,426,994.
Spider-Man Announces Closing Due To Weak Sales
The producers of Spider-man: Turn Off the Dark announced this week that the comic book hero musical would shutter in January, and a look at the numbers illustrates why. The cavernous Foxwoods Theatre was filled to 75.47% capacity this week, with the average paid admission at $80.23 per ticket.
While this might not be so bad for your average Broadway show, Spider-man had a notoriously pricey multi-millionaire investment, coupled with high weekly running costs, meaning that it can't afford to continue running with such modest sales numbers.
The Book Of Mormon Takes Top Spot
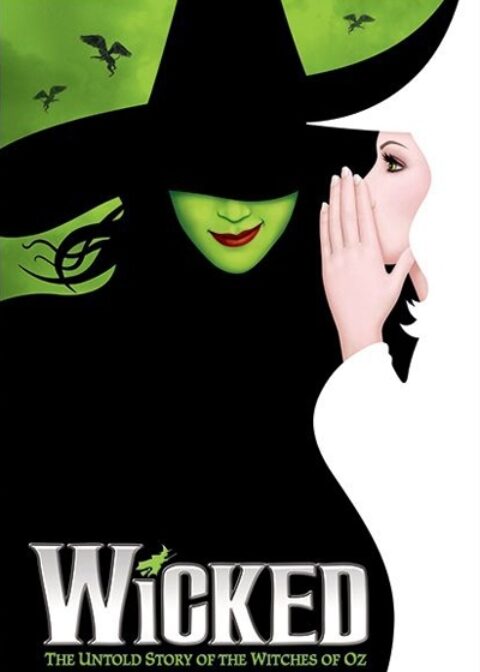
The seemingly never-ending wrestling match between Wicked, The Lion King, and The Book of Mormon for the #1 place on the Broadway grosses chart continued this week, but with an unexpected winner.
This time, The Book of Mormon, which usually has to settle for 3rd place, or 2nd at best, actually won the battle and hit the top spot with $1,677,524.
The following are the Broadway ticket sales numbers from the week ending November 24, 2013:

| Show | GrossGross | Total Attn | %Cap | AvgPdAdm |
| 700 SUNDAYS | $1,117,307 | 7,701 | 87.37% | $145.09 |
| A GENTLEMAN’S GUIDE TO LOVE AND MURDER | $414,591 | 5,403 | 79.55% | $76.73 |
| A NIGHT WITH JANIS JOPLIN | $359,718 | 3,987 | 65.49% | $90.22 |
| AFTER MIDNIGHT | $662,568 | 7,470 | 90.13% | $88.70 |
| ANNIE | $730,228 | 8,926 | 78.52% | $81.81 |
| BEAUTIFUL | $507,431 | 4,359 | 84.97% | $116.41 |
| BETRAYAL | $1,240,802 | 8,424 | 100.00% | $147.29 |
| BIG FISH | $453,940 | 7,223 | 63.99% | $62.85 |
| CHICAGO | $397,564 | 4,992 | 57.78% | $79.64 |
| CINDERELLA | $679,252 | 8,282 | 59.12% | $82.02 |
| FIRST DATE | $279,966 | 4,576 | 53.51% | $61.18 |
| JERSEY BOYS | $685,562 | 6,744 | 68.65% | $101.66 |
| KINKY BOOTS | $1,567,701 | 11,278 | 99.00% | $139.01 |
| MACBETH | $356,754 | 6,421 | 76.66% | $55.56 |
| MAMMA MIA! | $476,789 | 5,887 | 63.11% | $80.99 |
| MATILDA | $1,018,332 | 10,077 | 87.96% | $101.06 |
| MOTOWN: THE MUSICAL | $1,255,847 | 10,525 | 87.30% | $119.32 |
| NEWSIES | $688,579 | 7,908 | 83.42% | $87.07 |
| NO MAN’S LAND/WAITING FOR GODOT | $495,083 | 7,836 | 91.29% | $63.18 |
| ONCE | $589,705 | 6,043 | 71.33% | $97.58 |
| PIPPIN | $742,778 | 6,798 | 85.83% | $109.26 |
| ROCK OF AGES | $324,010 | 3,799 | 81.45% | $85.29 |
| ROMEO AND JULIET | $312,045 | 4,000 | 37.91% | $78.01 |
| SPIDER-MAN TURN OFF THE DARK | $766,811 | 9,558 | 75.47% | $80.23 |
| THE BOOK OF MORMON | $1,677,524 | 8,752 | 102.63% | $191.67 |
| THE GLASS MENAGERIE | $561,563 | 4,961 | 79.71% | $113.20 |
| THE LION KING | $1,560,773 | 12,946 | 95.19% | $120.56 |
| THE PHANTOM OF THE OPERA | $702,263 | 8,437 | 65.71% | $83.24 |
| THE SNOW GEESE | $181,489 | 3,848 | 74.00% | $47.16 |
| THE WINSLOW BOY | $271,373 | 4,299 | 72.62% | $63.12 |
| TWELFTH NIGHT/RICHARD III | $715,799 | 8,484 | 100.90% | $84.37 |
| WICKED | $1,632,849 | 13,449 | 92.93% | $121.41 |
| Totals: | $23,426,994 | 233,393 | 78.55% | $95.47 |
Broadway ticket sales raw data are provided courtesy of The Broadway League All other data, text, opinion, charts and commentary are copyright © 2013 nytix.com


