Broadway Show Ticket Sales Analysis For Week Ending 12/02/2012 Reflects Ticket Sales Normalizing After The Thanksgiving Holiday Boost
Sales Back To Normal Following Thanksgiving Boost
As expected, Broadway's total ticket revenue was considerably lower this week than it was Thanksgiving week, since Broadway always experiences abnormally high ticket sales during that holiday. However, this week's total earnings on Broadway, which amounted to $22,154,853, were still very good.
In fact, excluding last week's $27 million, that is the highest number Broadway has seen in total sales since August. December is traditionally a very good time for The Great White Way, since Christmas season tourists flood New York City during this time.
Broadway's Holiday Shows: "Elf" And "A Christmas Story"
This season, Broadway is hosting two musicals that are doing limited-run productions aimed squarely at the holiday theater-going crowd. Both Elf and A Christmas Story (each based on well-loved holiday films) are enjoying solid sales, earning $845,719 and $976,184, respectively.
However, given their particularly Christmas-y themes and recognizable names, it's surprising that they aren't doing a bit better. Elf, for instance, only filled its theater to 70% capacity, so the cheery musical could still stand to see better ticket sales. A Christmas Story is doing better, though, filling to nearly 85% capacity.
Long-Running Hits And Family Shows Fight For Tourist Dollars
Well-known shows like Chicago and Phantom, along with family-friendly fare like Annie and Spider-man are all wrangling to bring in the holiday visitors, and the results are rarely predictable. While the youth-friendly Newsies is doing very well (filling at 88.86% capacity, with an average paid admission of $99), Disney's Mary Poppins only filled 64.58% of its theater last week.
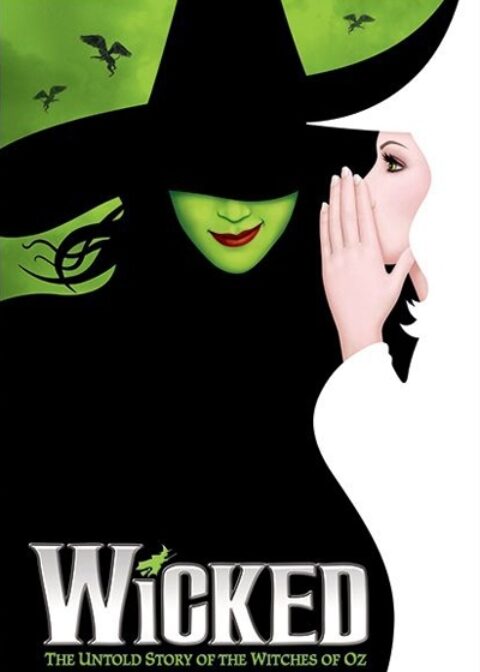
Long-running musical Jersey Boys is seeing better-than-usual sales, bringing in a total of $1,018,387 last week and filling to 89.45% capacity, while longtime tourist favorite Mamma Mia! only filled to 61.47%. When push came to shove, though, the week's winner in total sales was Wicked, followed very closely by risque hit The Book of Mormon, and perennial family favorite The Lion King.
The following are the Broadway ticket sales numbers from the week ending December 2, 2012:
| Show Name | GrossGross | TotalAttn | %Cap | AvgPaidAdm |
| A CHRISTMAS STORY | $976,184 | 10,196 | 84.13% | $95.74 |
| ANNIE | $948,150 | 10,204 | 74.68% | $92.92 |
| BRING IT ON THE MUSICAL | $391,162 | 5,906 | 55.34% | $66.23 |
| CHAPLIN | $354,820 | 4,713 | 56.38% | $75.29 |
| CHICAGO | $464,224 | 5,365 | 62.09% | $86.53 |
| DEAD ACCOUNTS | $410,308 | 6,789 | 84.11% | $60.44 |
| ELF | $845,719 | 8,971 | 70.00% | $94.27 |
| EVITA | $846,483 | 8,087 | 62.71% | $104.67 |
| GLENGARRY GLEN ROSS | $1,177,056 | 7,590 | 101.24% | $155.08 |
| GOLDEN BOY | $213,174 | 5,553 | 70.11% | $38.39 |
| GRACE | $323,974 | 4,197 | 48.62% | $77.19 |
| JERSEY BOYS | $1,018,387 | 8,788 | 89.45% | $115.88 |
| MAMMA MIA! | $623,646 | 7,366 | 61.47% | $84.67 |
| MARY POPPINS | $699,157 | 9,284 | 64.58% | $75.31 |
| NEWSIES | $841,298 | 8,495 | 88.86% | $99.03 |
| NICE WORK IF YOU CAN GET IT | $897,600 | 8,408 | 73.04% | $106.76 |
| ONCE | $1,046,542 | 8,073 | 95.38% | $129.63 |
| PETER AND THE STARCATCHER | $289,982 | 5,176 | 62.33% | $56.02 |
| ROCK OF AGES | $473,722 | 4,291 | 92.00% | $110.40 |
| SCANDALOUS | $370,243 | 4,099 | 37.56% | $90.33 |
| SPIDER-MAN TURN OFF THE DARK | $1,098,685 | 10,598 | 68.64% | $103.67 |
| THE ANARCHIST | $350,479 | 5,129 | 79.94% | $68.33 |
| THE BOOK OF MORMON | $1,672,310 | 8,752 | 102.63% | $191.08 |
| THE HEIRESS | $546,017 | 5,417 | 71.20% | $100.80 |
| THE LION KING | $1,647,968 | 12,607 | 93.97% | $130.72 |
| THE MYSTERY OF EDWIN DROOD | $351,796 | 5,688 | 70.82% | $61.85 |
| THE PHANTOM OF THE OPERA | $682,365 | 8,591 | 66.91% | $79.43 |
| WAR HORSE | $603,197 | 6,558 | 76.68% | $91.98 |
| WHO’S AFRAID OF VIRGINIA WOOLF? | $293,426 | 3,317 | 60.60% | $88.46 |
| WICKED | $1,696,781 | 12,403 | 85.70% | $136.80 |
| TOTAL: | $22,154,853 | 220,611 | 73.71% | $95.60 |
Broadway ticket sales raw data are provided courtesy of The Broadway League All other data, text, opinion, charts and commentary are copyright © 2012 nytix.com


