Broadway Show Ticket Sales Analysis For Week Ending 03/24/2013 Shows Another Jump In Ticket Sales During Busy Spring Season With Three Shows Debuting
Broadway Ticket Grosses Blooming
Though not as impressive as last week's rise, the Broadway ticket sales numbers once again increased this week. Gaining just under one million dollars, ticket revenue rose from last week's $20,821,011 up to $21,709,082.
Three New Broadway Productions Debut
There are three additional Broadway shows on the chart this week, as three new productions started previews this week. Each has started out on a very different foot, with the new Pippin revival coming out on top with 99.30% capacity and an average paid admission of $101.28.
The Nance, which brings Broadway favorite Nathan Lane back to the Great White Way, has started out with fair but unimpressive sales, getting an average of $71.42 per ticket. The Assembled Parties has had the hardest time of the trio, earning only $44.13 average admission.
Eight Shows Earn Over One Million
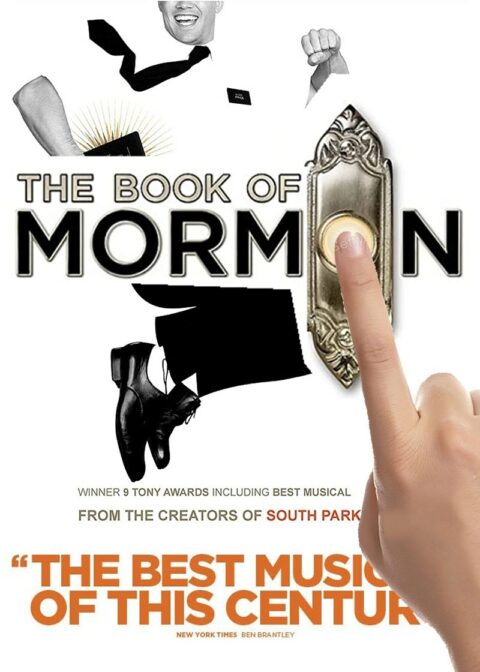
With the winter blues (if not the winter weather) now behind us, Broadway is now seeing more and more millionaires. Last week and again this week there were a total of eight shows that brought in over one million for the weekly total. Among those are of course the big three, The Lion King, The Book of Mormon, and the week's winner, Wicked, which came extremely close to two million at $1,940,002.
Other Millionaire's Club members include popular hits like The Phantom of the Opera and Spiderman, but the wealth has also been shared with several newcomers, Cinderella, Lucky Guy, and Motown the Musical.
The following are the Broadway ticket sales numbers from the week ending March 24, 2013:

| Show Name | GrossGross | TotalAttn | %Cap | AvgPaidAdm |
| ANN | $363,340 | 5,500 | 61.77% | $66.06 |
| ANNIE | $941,132 | 10,906 | 79.82% | $86.29 |
| BREAKFAST AT TIFFANY’S | $357,127 | 6,116 | 70.85% | $58.39 |
| CAT ON A HOT TIN ROOF | $647,429 | 6,836 | 61.74% | $94.71 |
| CHICAGO | $667,034 | 7,707 | 89.20% | $86.55 |
| CINDERELLA | $1,122,624 | 12,108 | 86.44% | $92.72 |
| HANDS ON A HARDBODY | $211,083 | 6,415 | 77.18% | $32.90 |
| JERSEY BOYS | $883,045 | 9,062 | 92.24% | $97.44 |
| KINKY BOOTS | $852,171 | 10,893 | 95.62% | $78.23 |
| LUCKY GUY | $1,270,733 | 9,451 | 99.95% | $134.45 |
| MAMMA MIA! | $842,657 | 10,128 | 85.60% | $83.20 |
| MATILDA | $834,560 | 9,935 | 99.39% | $84.00 |
| MOTOWN: THE MUSICAL | $1,015,331 | 10,552 | 102.90% | $96.22 |
| NEWSIES | $945,008 | 9,578 | 100.19% | $98.66 |
| NICE WORK IF YOU CAN GET IT | $658,957 | 7,659 | 66.53% | $86.04 |
| ONCE | $966,182 | 8,222 | 97.14% | $117.51 |
| PIPPIN | $199,935 | 1,974 | 99.30% | $101.28 |
| ROCK OF AGES | $460,871 | 4,527 | 97.06% | $101.80 |
| SPIDER-MAN TURN OFF THE DARK | $1,160,466 | 12,866 | 83.33% | $90.20 |
| THE ASSEMBLED PARTIES | $109,183 | 2,474 | 76.12% | $44.13 |
| THE BIG KNIFE | $105,646 | 2,799 | 75.65% | $37.74 |
| THE BOOK OF MORMON | $1,661,180 | 8,752 | 102.63% | $189.81 |
| THE LION KING | $1,892,803 | 13,467 | 100.38% | $140.55 |
| THE NANCE | $199,627 | 2,795 | 76.28% | $71.42 |
| THE PHANTOM OF THE OPERA | $1,042,563 | 12,452 | 96.98% | $83.73 |
| VANYA AND SONIA AND MASHA AND SPIKE | $358,395 | 5,073 | 80.57% | $70.65 |
| WICKED | $1,940,002 | 14,161 | 97.85% | $137.00 |
| Total | $21,709,082 | 222,408 | 87.14% | $91.17 |
Broadway ticket sales raw data are provided courtesy of The Broadway League All other data, text, opinion, charts and commentary are copyright © 2012 nytix.com


