Broadway Show Ticket Sales Analysis For Week Ending 05/19/2013 Reflects A Modest Increase In Overall Ticket Revenue With Several Shows Selling Out
Broadway Ticket Sales Get A Small Increase
At last, grosses are looking up on Broadway -- even if not by much. This week Broadway's total ticket revenue saw a modest increase, going from last week's $24,246,231 up to $24,657,284.
Several Broadway Shows Selling Out
A total of seven Broadway shows came in at 100% capacity or more this week: I'll Eat You Last, Kinky Boots, Lucky Guy, Matilda, Motown the Musical, Pippin, and The Book of Mormon. Interestingly, none of those shows are among the top two earners this week.
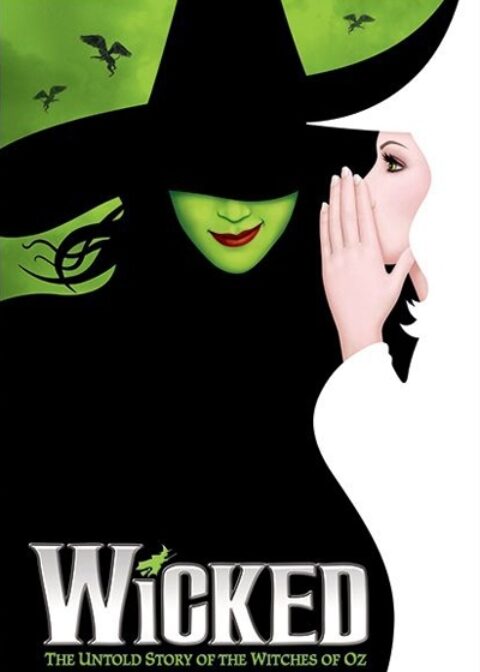
The Lion King and Wicked took the number one and two spots, respectively, bringing in the highest grosses because they are housed in particularly large theaters and are still popular enough to command high ticket prices.
"Orphans" Concludes With Decent Sales
The Broadway play Orphans, starring Alec Baldwin, Ben Foster, and Tony nominee Tom Sturridge, ended its run at the Gerald Schoenfeld Theatre early, presumably due to low ticket sales. Its final week saw fair but unimpressive sales, filling the theater to 84.54% capacity with an average paid admission of $68.84.
The following are the Broadway ticket sales numbers from the week ending May 19, 2013:

| Show Name | GrossGross | TotalAttn | %Cap | Avg Paid Admission |
| ANN | $247,041 | 3,528 | 39.62% | $70.02 |
| ANNIE | $842,272 | 10,854 | 79.44% | $77.60 |
| CHICAGO | $697,597 | 7,871 | 91.10% | $88.63 |
| CINDERELLA | $1,017,256 | 12,032 | 85.89% | $84.55 |
| I’LL EAT YOU LAST: A CHAT WITH SUE MENGERS | $829,768 | 5,559 | 102.21% | $149.27 |
| JERSEY BOYS | $956,177 | 9,056 | 92.18% | $105.58 |
| KINKY BOOTS | $1,269,683 | 11,496 | 100.91% | $110.45 |
| LUCKY GUY | $1,387,476 | 9,687 | 102.44% | $143.23 |
| MACBETH | $444,348 | 5,037 | 80.57% | $88.22 |
| MAMMA MIA! | $822,902 | 9,507 | 79.33% | $86.56 |
| MATILDA | $1,063,972 | 11,456 | 100.00% | $92.87 |
| MOTOWN: THE MUSICAL | $1,249,920 | 12,152 | 100.80% | $102.86 |
| NEWSIES | $839,892 | 9,297 | 98.07% | $90.34 |
| NICE WORK IF YOU CAN GET IT | $760,202 | 8,975 | 77.96% | $84.70 |
| ONCE | $859,871 | 7,960 | 93.96% | $108.02 |
| ORPHANS | $498,625 | 7,243 | 84.54% | $68.84 |
| PIPPIN | $869,274 | 7,985 | 100.82% | $108.86 |
| ROCK OF AGES | $450,030 | 4,532 | 97.17% | $99.30 |
| SPIDER-MAN TURN OFF THE DARK | $1,032,689 | 12,098 | 78.35% | $85.36 |
| THE ASSEMBLED PARTIES | $354,725 | 4,914 | 94.50% | $72.19 |
| THE BIG KNIFE | $229,239 | 3,868 | 65.34% | $59.27 |
| THE BOOK OF MORMON | $1,701,989 | 8,752 | 102.63% | $194.47 |
| THE LION KING | $1,887,665 | 13,448 | 98.88% | $140.37 |
| THE NANCE | $499,762 | 5,965 | 81.40% | $83.78 |
| THE PHANTOM OF THE OPERA | $1,078,051 | 12,454 | 96.99% | $86.56 |
| THE TRIP TO BOUNTIFUL | $469,185 | 5,450 | 64.09% | $86.09 |
| VANYA AND SONIA AND MASHA AND SPIKE | $549,536 | 5,935 | 94.27% | $92.59 |
| WICKED | $1,748,141 | 13,881 | 95.92% | $125.94 |
| Totals: | $24,657,284 | 240,992 | 88.55% | $99.52 |
Broadway ticket sales raw data are provided courtesy of The Broadway League. All other data, text, opinion, charts and commentary are copyright © 2013 nytix.com.


