Broadway Show Ticket Sales Analysis For Week Ending 05/12/2013 Show Sales Creeping Slowly Down In Advance Of The Busy Tourist Summer Season
Death By A Thousand Cuts : Yet Another Small Decrease In Sales For Broadway
Broadway's total ticket sales continue to creep slowly downward, decreasing from last week's $24,611,041 down to this week's $24,246,231. While this trend is far from welcome, it is not dramatic enough to be of serious concern. Broadway producers are likely hoping that the summer tourist season will provide a boost in sales next month.
Jekyll & Hyde Ends On A Mediocre Note
The Frank Wildhorn musical Jekyll & Hyde, a hit when it first appeared on Broadway in the late '90s, did not meet with such success on its recent return to Broadway. The revival starring Constantine Maroulis only played briefly before shuttering this past Sunday. In its final week, the romantic melodrama filled just over half its theater at 54.04% capacity, with an average paid admission of $63.11.
The Lion King Dominates The Broadway Box Office
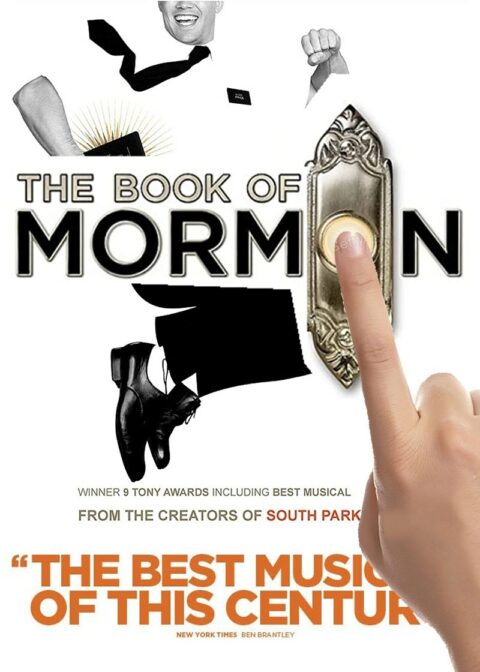
Disney's The Lion King continues to lord it over the Broadway jungle, holding the top spot in total ticket sales with weekly earnings of $1,846,975. Wicked and The Book of Mormon came in second and third place, respectively.
The following are the Broadway ticket sales numbers from the week ending May 12, 2013:

| Show Name | GrossGross | TotalAttn | %Cap | AvgPaidAdm |
| ANN | $241,037 | 3,445 | 38.69% | $69.97 |
| ANNIE | $743,412 | 8,970 | 65.65% | $82.88 |
| CHICAGO | $641,445 | 7,705 | 89.18% | $83.25 |
| CINDERELLA | $911,022 | 10,010 | 71.46% | $91.01 |
| I’LL EAT YOU LAST: A CHAT WITH SUE MENGERS | $865,144 | 6,271 | 100.9% | $137.96 |
| JEKYLL & HYDE | $439,818 | 6,969 | 54.04% | $63.11 |
| JERSEY BOYS | $891,835 | 8,881 | 90.40% | $100.42 |
| KINKY BOOTS | $1,250,718 | 11,398 | 100.1% | $109.73 |
| LUCKY GUY | $1,389,588 | 9,610 | 101.6% | $144.60 |
| MACBETH | $433,127 | 4,609 | 73.72% | $93.97 |
| MAMMA MIA! | $880,486 | 9,965 | 83.15% | $88.36 |
| MATILDA | $1,124,333 | 11,456 | 100.3% | $98.14 |
| MOTOWN: THE MUSICAL | $1,194,456 | 12,150 | 100.8% | $98.31 |
| NEWSIES | $787,730 | 9,323 | 98.34% | $84.49 |
| NICE WORK IF YOU CAN GET IT | $644,906 | 7,828 | 68.00% | $82.38 |
| ONCE | $814,582 | 7,549 | 89.11% | $107.91 |
| ORPHANS | $369,078 | 6,518 | 76.07% | $56.62 |
| PIPPIN | $861,233 | 7,997 | 101.0% | $107.69 |
| ROCK OF AGES | $406,838 | 4,405 | 94.45% | $92.36 |
| SPIDER-MAN TURN OFF THE DARK | $1,002,757 | 11,236 | 72.77% | $89.24 |
| THE ASSEMBLED PARTIES | $347,277 | 4,631 | 89.06% | $74.99 |
| THE BIG KNIFE | $206,469 | 3,675 | 62.08% | $56.18 |
| THE BOOK OF MORMON | $1,692,483 | 8,752 | 102.6% | $193.38 |
| THE LION KING | $1,846,975 | 13,588 | 99.91% | $135.93 |
| THE NANCE | $470,195 | 5,521 | 75.34% | $85.16 |
| THE PHANTOM OF THE OPERA | $1,039,572 | 12,244 | 95.36% | $84.90 |
| THE TRIP TO BOUNTIFUL | $562,796 | 6,416 | 75.45% | $87.72 |
| VANYA AND SONIA AND MASHA AND SPIKE | $489,914 | 5,145 | 81.72% | $95.22 |
| WICKED | $1,697,007 | 13,967 | 96.51% | $121.50 |
| Total | $24,246,231 | 240,234 | 84.39% | $97.15 |
Broadway ticket sales raw data are provided courtesy of The Broadway League. All other data, text, opinion, charts and commentary are copyright © 2013 nytix.com.


